RF · Microwave Study
Separating Harmonics, IMD, P1dB, and IP3 on One Graph
I moved beyond small-signal gain and tracked how fundamentals and distortion change as input level rises.
- Sequence
- 7 / 32
- Track
- core
- Tools
- RF calculators
On this page
Question I started with
I moved beyond small-signal gain and tracked how fundamentals and distortion change as input level rises.
Connecting the concepts
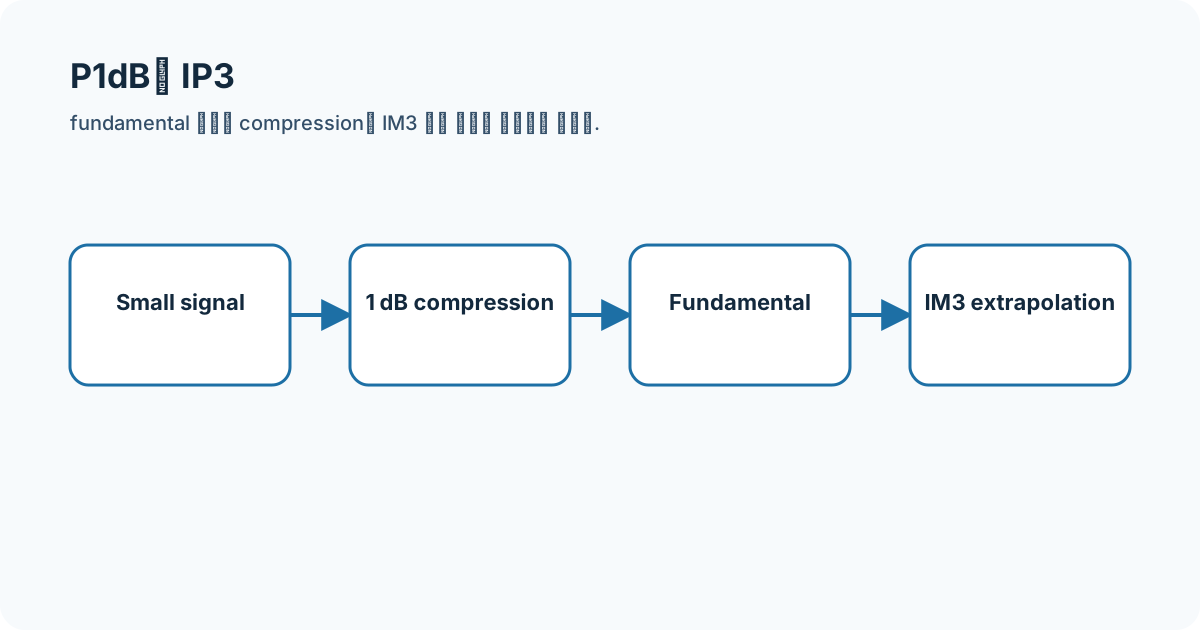
Second- and third-order polynomial terms create harmonics and intermodulation. P1dB is a measured compression point, while IP3 is an extrapolated intersection and not an operating point.
- harmonic
- IMD
- P1dB
- IP3
- compression
Equations and assumptions
I write the reference impedance, units, and linear-versus-decibel domain before substituting numbers.
y = a1 x + a2 x^2 + a3 x^3OIP3 = P_out + Delta_IM3 / 2Worked example
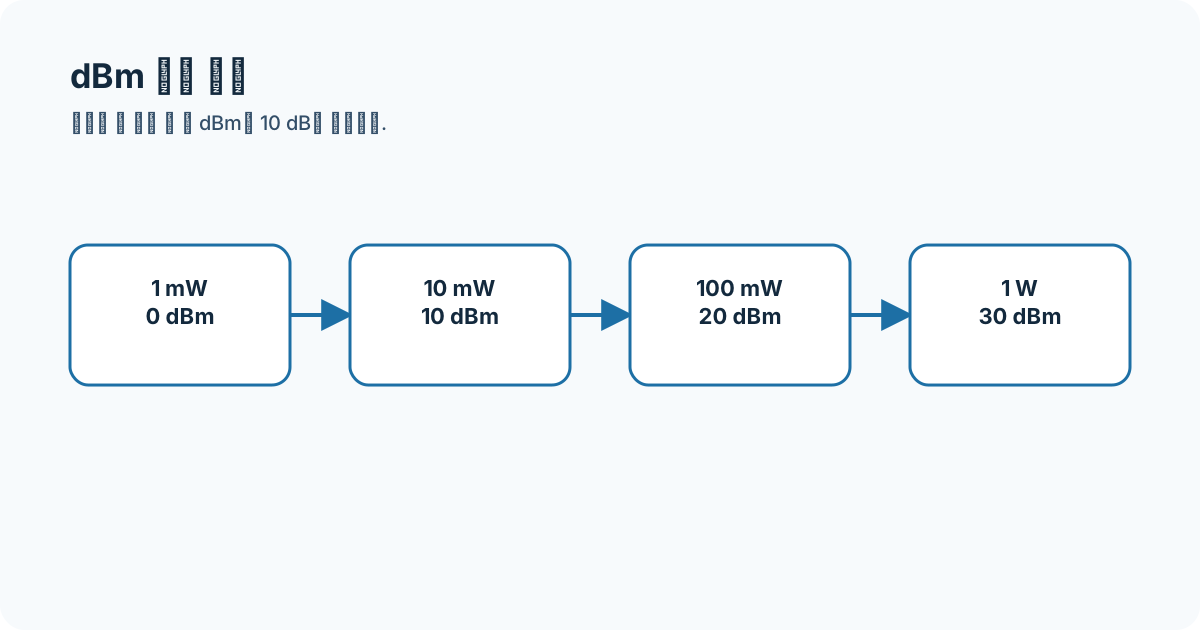
If one fundamental output is 0 dBm and adjacent IM3 is −30 dBm, ΔIM3=30 dB and OIP3≈15 dBm under the straight-line extrapolation.
Connecting it to my coursework and projects
My coursework archive does not contain P1dB/IP3 measurement results, so this calculation is a study example rather than a new result extracted from the stored Cadence screens.
High-frequency engineering course hub
What I will check next
A high IP3 does not define all large-signal behavior; bias, bandwidth, temperature, tone spacing, memory effects, and setup also matter.