mmWave · FMCW Radar · Radar Signal Processing
Isolating a DCA1000EVM Raw-ADC Capture Failure by Data Path
2026-09-09 · updated 2026-09-09 · Hyeongrok Ryu
A DCA1000EVM troubleshooting case that separates visible control UDP from a zero-packet raw capture using Wireshark, UniFlash, Tera Term, and hardware checks.
- Type / level
- troubleshooting · advanced
- Tools
- IWR6843ISK, DCA1000EVM, mmWave Studio, Wireshark, UniFlash, Tera Term, Oscilloscope
Missing raw data and board heating
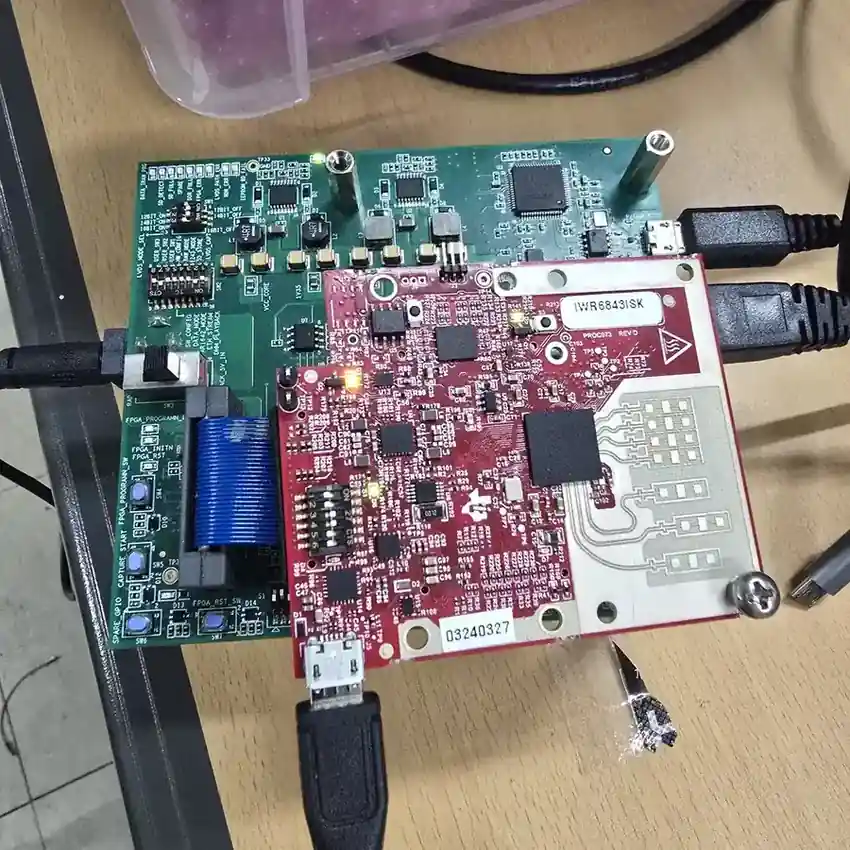
I connected a DCA1000EVM to collect raw ADC samples from the IWR6843. Wireshark showed short control UDP datagrams between the PC and the board, but the raw capture log counted zero received packets and the board also heated up. Changing code first would have mixed configuration faults with physical faults. I preserved the observed state, then traced the sample path separately from the path that brings the devices into capture mode.
Two byte-identical duplicate files are shown once each; all 36 distinct debugging screens are placed directly in the staged narrative below. Each screen opens at full size when selected.
Separating the data path from the control path
Using TI’s raw-mode architecture, I mapped the sample path as IWR6843 ADC →
LVDS → DCA1000 FPGA → DDR3L/packet path → Ethernet → PC. A different sequence
selects power and operating mode, establishes FTDI, RS232, and SPI connectivity,
resets and configures the devices, and starts capture. Splitting one symptom into
these two paths produced concrete observation points.
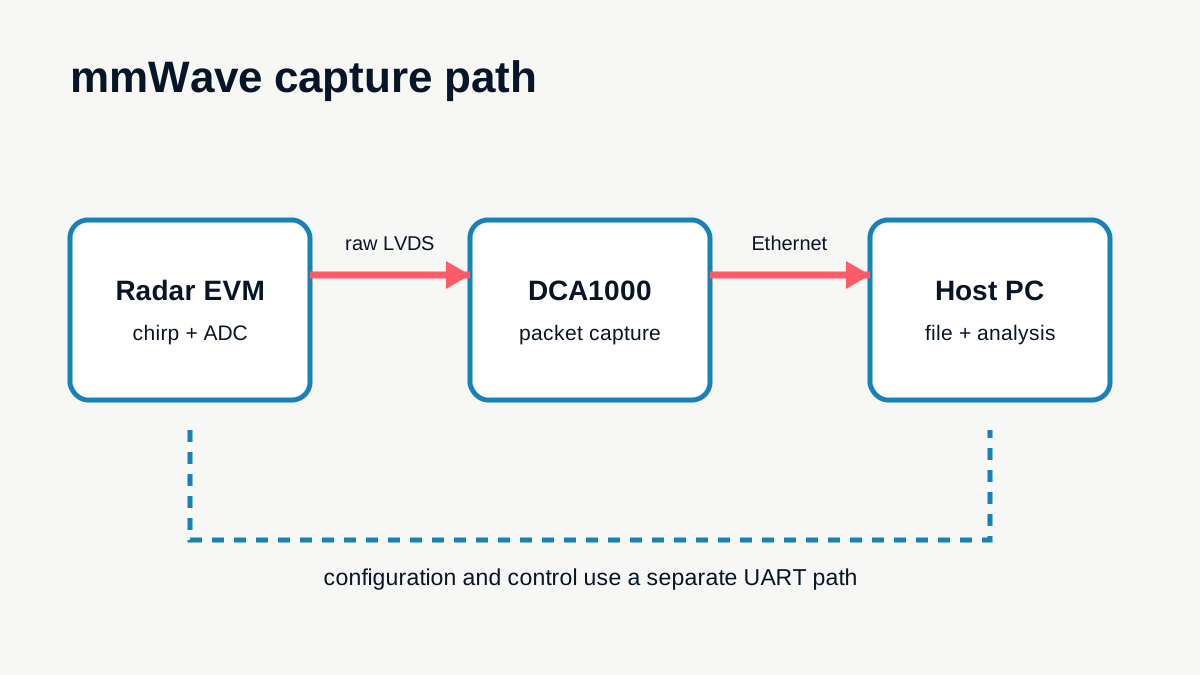
Data path   : IWR6843 raw ADC -> LVDS -> FPGA/buffer -> Ethernet -> PC
Control path: power/mode -> FTDI/RS232/SPI -> reset/config -> capture start
Using the GUI as the first observation point
In mmWave Studio, FTDI appeared as Connected, yet the detected-device count
was zero and both RS232 and SPI appeared as Disconnected. RF Power-up also
produced ReadRegister failed with error -11. PC-side FTDI enumeration was
therefore not equivalent to a working radar-control path.
Error        : no raw ADC stream, device count 0, ReadRegister -11
Cause scope  : mode/configuration, interconnect, power, LVDS/FPGA/buffer, Ethernet
Verification : GUI state, LED labels, connector/solder inspection, oscilloscope probes
Separating control UDP from raw data in Wireshark
I assigned 192.168.33.30 to the PC and 192.168.33.180 to the DCA1000EVM,
then inspected udp.port == 4096 || udp.port == 4098. The capture repeatedly
showed short 8- and 14-byte datagrams from the PC to configuration port 4096.
This proves that control datagrams left the PC NIC; it does not prove that LVDS
samples returned as Ethernet data packets.
Isolating firmware programming with UniFlash
Using UniFlash on COM7, I erased the IWR6843 SFLASH and downloaded META_IMAGE1.
The console retained Erase storage completed successfully, downloaded
successfully to SFLASH, and Program Load completed successfully. I therefore
recorded firmware programming as a successful stage. That result does not prove
the later RF configuration, LVDS enable, DCA1000 packetization, or raw capture.
Checking the UART CLI in Tera Term
Tera Term on COM7 displayed the mmwDemo:/> prompt, while several inputs were
followed by is not recognized as a CLI command. The screen therefore preserves
two separate observations: the firmware prompt was readable over the serial port,
but those inputs were not accepted as valid commands. Command spelling, line
ending, the running image, and CLI state remained candidates; the screen does not
identify one cause by itself.
Using the capture log as the stop condition
The record directory contained configuration and log files, but no raw .bin
file. The log reported Number of received packets - 0, first and last packet
IDs of 0, and a duration of -2 seconds. I used this direct outcome to avoid
treating Ethernet-adapter visibility or control traffic as a successful raw capture.
Using LEDs and power as hardware observation points
Several status LEDs were illuminated simultaneously in a hardware photograph. I used their labels to choose the next measurement points, but did not infer a failed FPGA, DDR device, or LVDS interface from a single LED state. Board heating also lacked a measured location and temperature, so it was treated as a symptom rather than proof of a particular failed component.
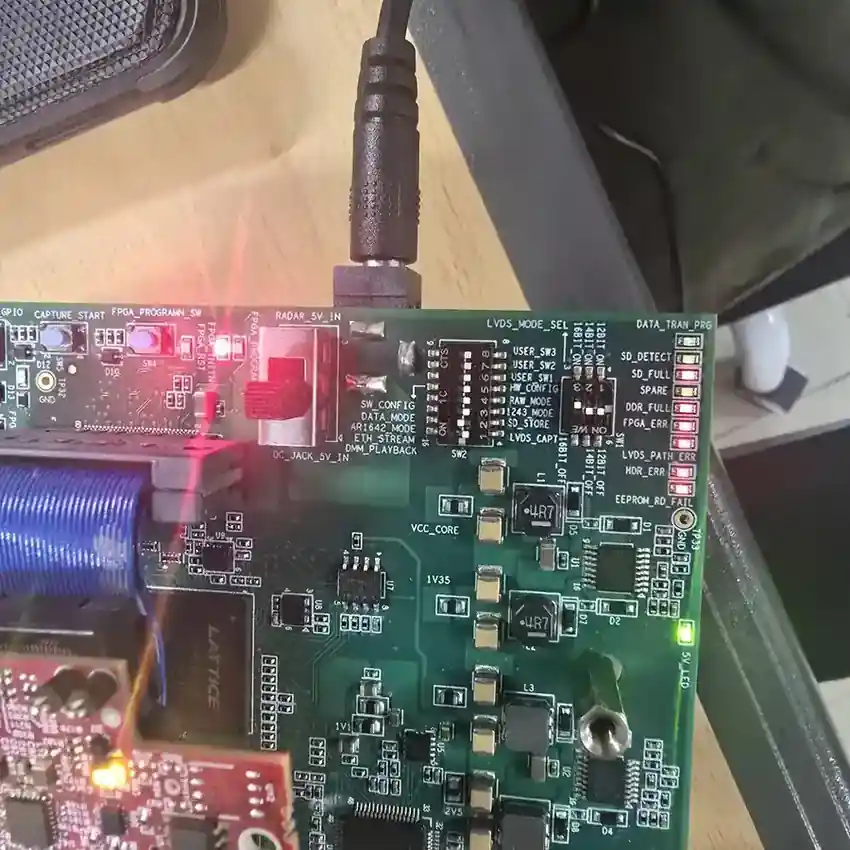
Narrowing the hardware path
- I checked the 5-V input, board power state, and when heating appeared.
- I revisited DIP-switch positions, operating mode, reset, configuration, and capture-start order.
- I inspected board-to-board connectors, cable contact, and solder joints, then reworked suspicious joints.
- I probed accessible power and signal points with an oscilloscope.
- I compared the PC’s static IP, UDP control traffic, and zero-packet capture log independently of the physical checks.
The purpose was to verify whether each stage produced the condition required by the next stage before replacing components or making broad software changes.
Recording the stop decision and open scope
Ethernet raw-ADC streaming was not restored after solder rework and repeated configuration. Control UDP, successful flashing, and a UART prompt were each observed, but I could not establish whether the FPGA buffer was receiving valid samples or identify a failed component. I stopped using this capture path and retained the observed error states, probe locations, and unanswered boundaries for a future board-level investigation.
The raw-ADC capture failure is separate from the TI SDK-based 3D People Tracking run. The latter received processed point-cloud and target data over dual UART; it is not evidence that the DCA1000 LVDS-to-Ethernet path recovered.
Debugging competency carried forward
The central lesson was not to assign a physical cause to a missing-data symptom too early. I turned flash programming, the UART CLI, UDP control, the raw packet count, power and heat, connectors and solder, and LVDS buffering into staged observation points. I also kept confirmed states, plausible causes, and unmeasured areas distinct through the stop decision. The same approach applies to radar and autonomous-sensor validation, embedded-hardware bring-up, production failure analysis, and advanced-quality investigations.
Sources used
- DCA1000EVM troubleshooting archive — project-archive; observed states, fault-isolation sequence, and unresolved result
- DCA1000EVM Data Capture Card User's Guide Rev. A — vendor-documentation; LVDS, FPGA, DDR3L, Ethernet, switch, and raw-mode architecture
- Texas Instruments DCA1000EVM product page — vendor-documentation; real-time LVDS capture and 1-Gbps Ethernet streaming role