mmWave · FMCW Radar · Radar Signal Processing
From IWR6843 Configuration to 3D People-Tracking Output
2026-09-04 · updated 2026-09-04 · Hyeongrok Ryu
A system-integration case spanning IWR6843 EVM setup, DSS processing, dual UART, and Visualizer output.
- Type / level
- project-log · advanced
- Tools
- IWR6843ISK, IWR6843AOP, TI Radar Toolbox, Code Composer Studio, SYS/BIOS, UART
Test setup
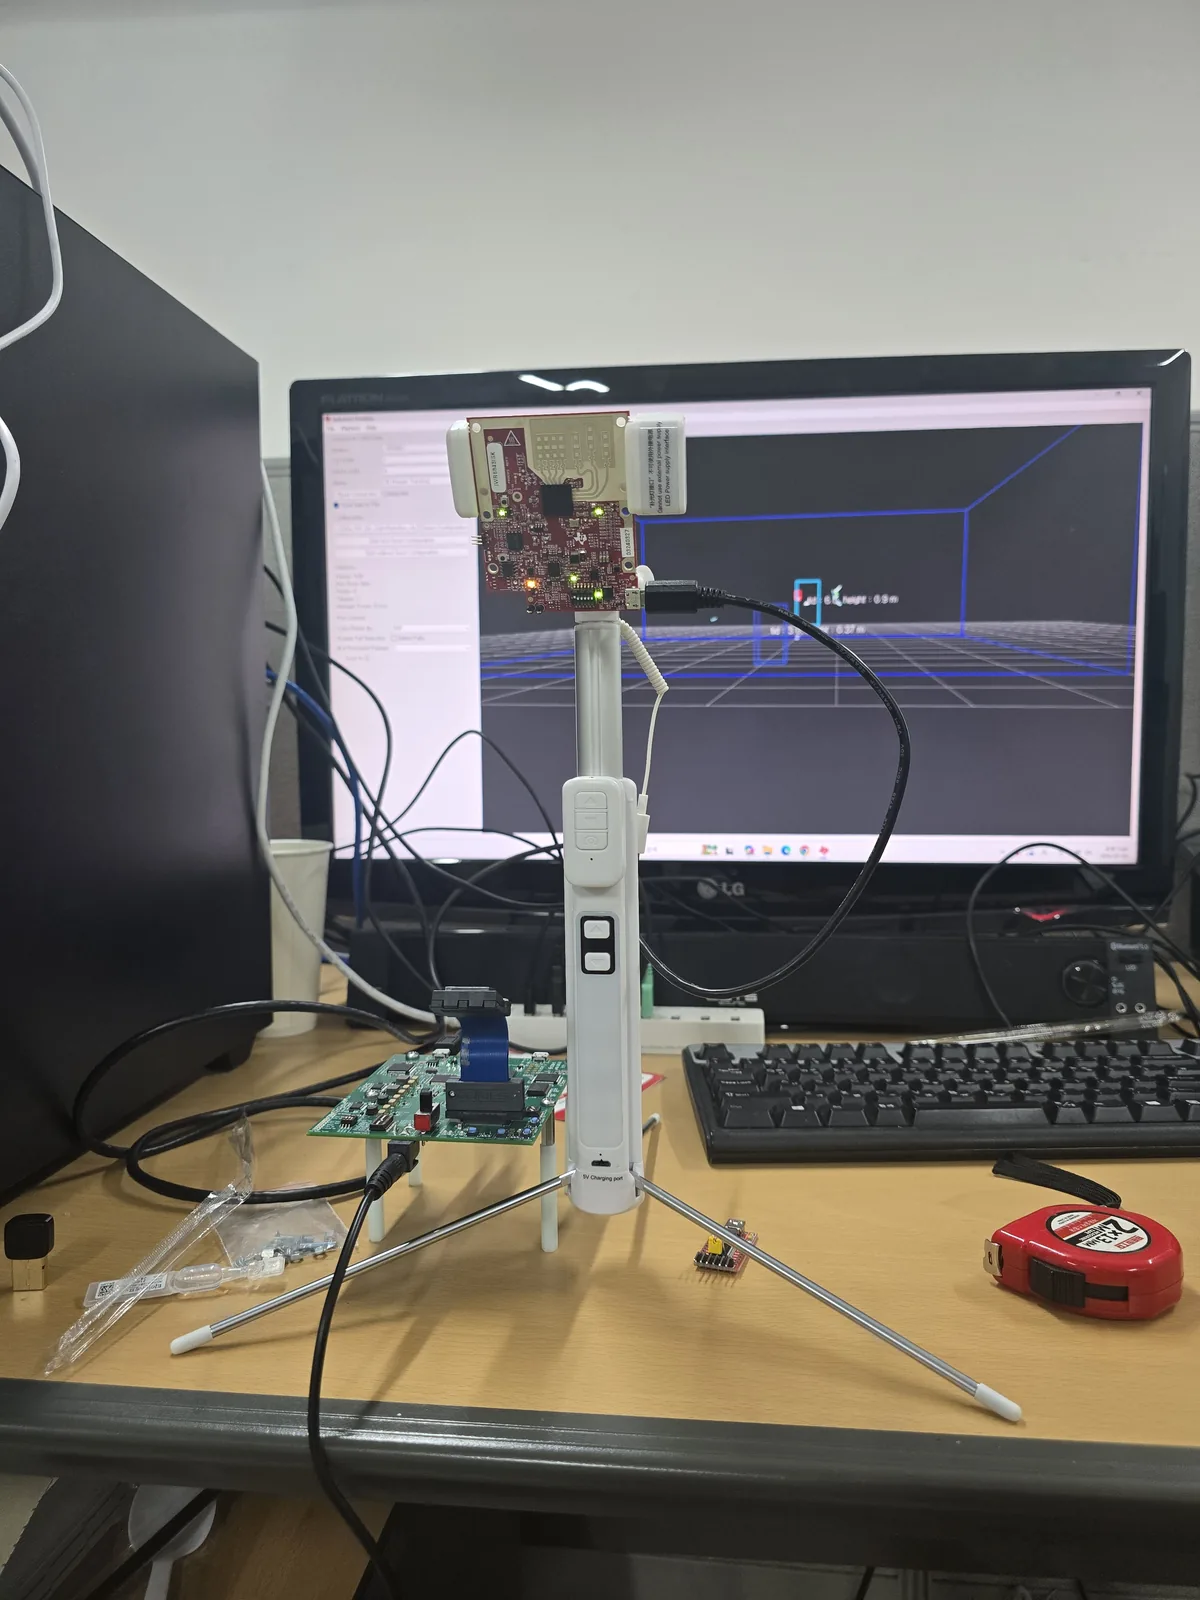
I mounted the IWR6843-family EVM on a stand and aligned its height and orientation with the direction of movement. Mounting pose and the observation region affect whether points leave the display or floor clutter dominates, so I adjusted the physical setup while watching the GUI output.
Radar processing
The retained DSS project shows range and Doppler processing followed by 2D Capon/MVDR beamforming and dynamic/static CFAR. Those stages produce point-cloud and target-list outputs with angle, Doppler, and SNR information. I mapped each GUI point back to the sequence from chirps through detection instead of treating the screen as a standalone sensor output.
DSS-to-MSS handoff
The C674x DSS build and SYS/BIOS configuration handle radar processing. Results then move through shared memory and a mailbox toward the MSS data path. The retained package contains an MSS binary but not its matching source, so I focused on the interface between DSS output and the serial packet consumed by the GUI.
Two UART links
I separated the CLI and data ports during connection. The CLI uses 115200 bps for sensor configuration, while the data port uses 921600 bps for point-cloud and target packets. A swapped port or mismatched baud rate can let configuration pass while the screen stalls—or leave incoming data undecodable. This distinction helped isolate hardware, firmware, and PC-application issues.
CLI UART  : 115200 bps  -> sensor configuration
Data UART : 921600 bps  -> point cloud and target packets
Visualizer output
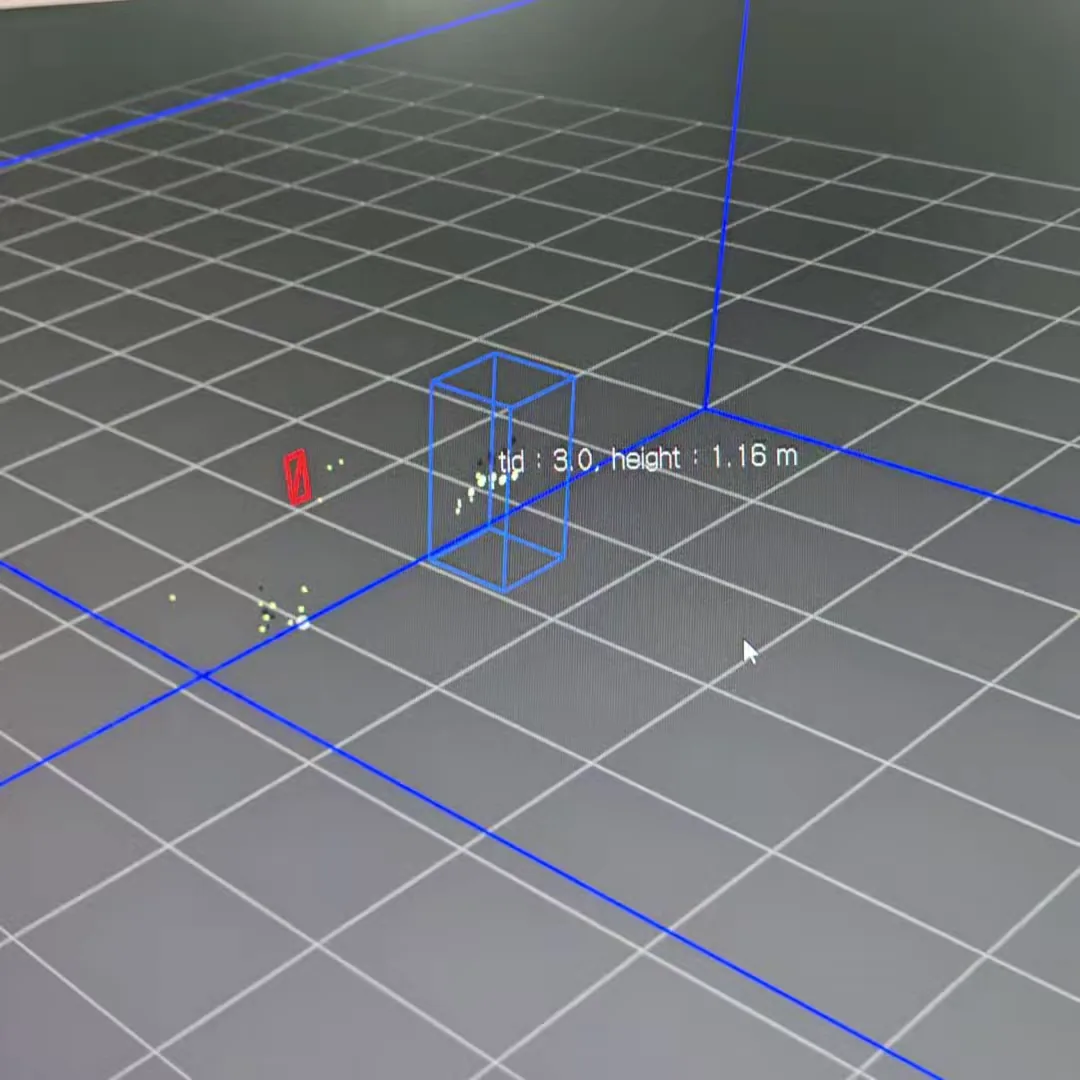
After changing sensor position, FOV, range, boundary, and detection thresholds, I compared target IDs and bounding boxes over time in the 3D tracking view. I also inspected the range profile, point cloud, and vital-sign display.
Current scope
Recorded work: EVM setup, DSS build analysis, dual-UART integration, and Visualizer output using TI examples. The 18.17-second run contains a moving 3D target. The vital-sign view records UI output; clinical, CAN/LIN, and environmental/EMC evaluation are separate stages.
Sources used
- TI Radar Toolbox project archive and Visualizer captures — project-archive; system architecture and runtime-output review