Week 12
Re-reading S-Parameter Figures
I revisit transmission lines through Wilkinson and branch-line networks using my assignments, Cadence circuits, and S-parameter figures.
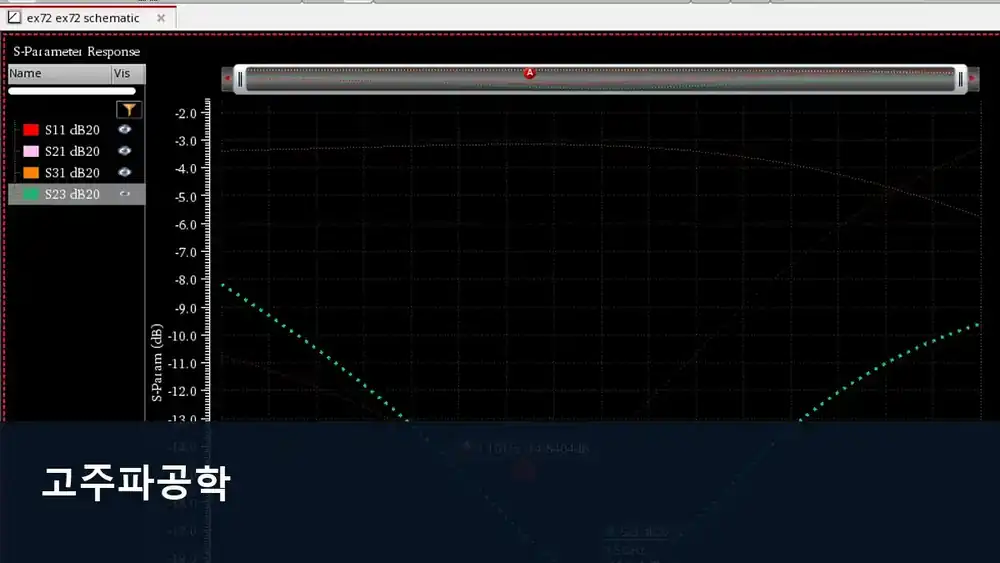
What I connect in this unit
Re-reading an S-parameter figure requires comparing marker frequency, design target, and curve result in consistent units. Resonance shift can guide diagnosis, but archived figures must remain distinct from redrawn diagrams or new runs.
Concept map
- Marker frequency
- Target-result comparison
- Resonance shift
- Distinguishing archived and redrawn figures
Technical anchor
Define target frequency ft and observed minimum or crossing fr, then use Δf=fr-ft and relative shift Δf/ft. Label each figure as archive, redraw, or simulation and record the trace name used.
How I review it
Check axis range, dB scale, port index, and marker label before comparing with the target table. When conditions are absent, report only what the figure displays and avoid claims about cause or reproducibility.
Connection to the full course
Unit 12 of 12. Unit numbers arrange the saved assignments and circuits by concept flow rather than attendance weeks.