AI · Deep Learning · Computer Vision · Generative AI
Starting with Generative Models and Data Distributions
2026-08-01 · updated 2026-08-01 · Hyeongrok Ryu
My notes comparing discriminative and generative models before checking tensor shapes and visualizing data.
- Type / level
- study-note · beginner
- Tools
- Python, PyTorch, Matplotlib
First question
I reframed generation as approximating the distribution of observed (x) and sampling from it, rather than simply producing an image.
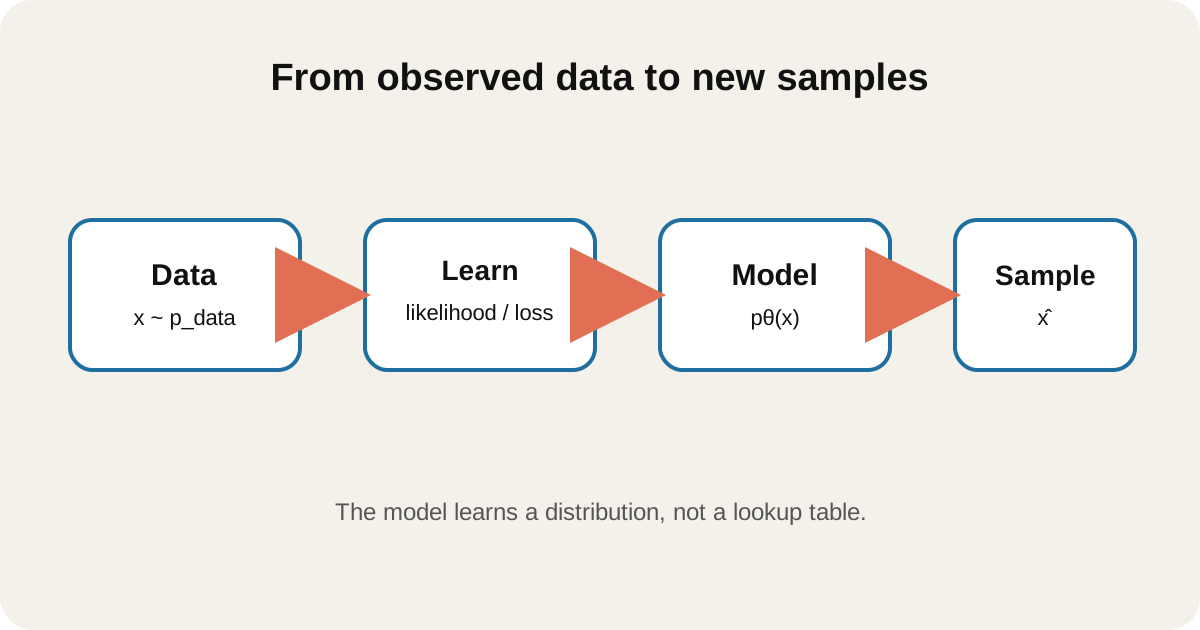
Learning a distribution
| Classification focuses on a conditional such as (p(y | x)); generation works with (p(x)) or a joint distribution. This made autoregressive models, VAEs, GANs, and diffusion comparable under one question. |
Tensor shapes
I printed (N, C, H, W) before building the model and checked the feature count after flattening. Silent broadcasting can produce a numeric loss with the wrong meaning.
Plotting the data
I inspected class balance, ranges, missing values, and duplicates. Normalization statistics came only from the training split to avoid leakage.
Next connection
The next note factorizes a difficult joint distribution and converts maximum likelihood into a trainable loss.
Sources used
- PyTorch Learn the Basics — official-documentation; tensor and training workflow