AI · Deep Learning · Computer Vision · Model Evaluation
Preserving evaluation conditions for AUC and F1 in PPG-HRV classification
2026-07-31 · updated 2026-09-17 · Hyeongrok Ryu
Why subject splits, folds, preprocessing, confusion matrices, and paper-reported metrics are not merged into one performance value.
- Type / level
- study-note · intermediate
- Tools
- Python, CNN, HRV
Questions before comparing values
Matching model and metric names do not make two values comparable. In PPG-HRV classification, the result changes with these decisions:
- Can segments from one participant enter both train and test sets?
- Is the split made by sample, recording, session, or subject?
- Was preprocessing or peak rejection fitted before the folds were formed?
- Is AUC the mean of fold values or a pooled prediction result?
- Is F1 binary, macro, or weighted?
Without those conditions, a number such as 0.85 cannot be reproduced or interpreted correctly.
PPG-to-classification pipeline
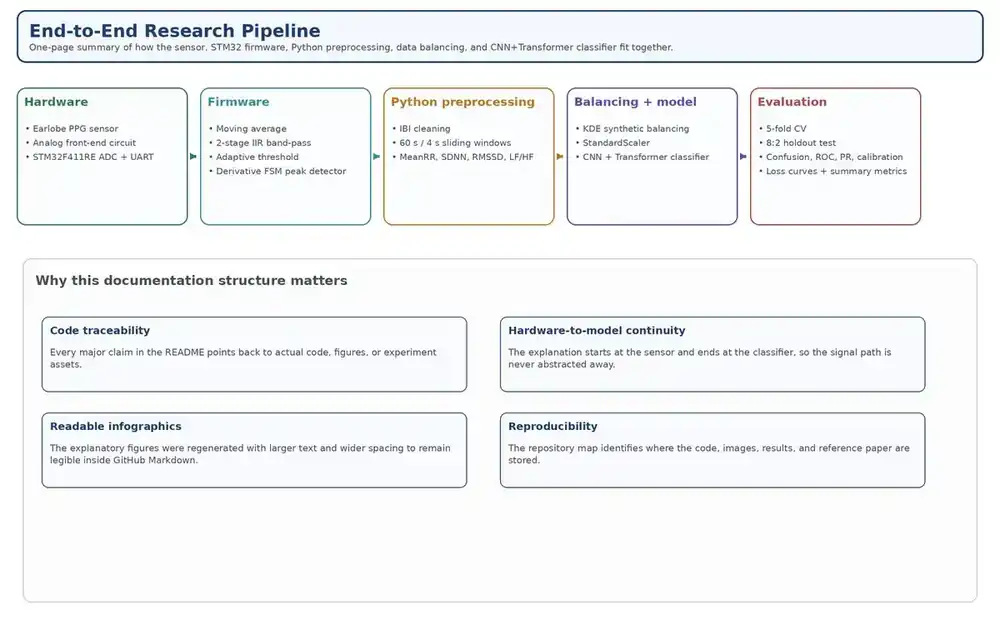
An earlobe PPG sensor and analog front-end feed samples to STM32 acquisition. Peak locations produce inter-beat intervals, followed by time- and frequency-domain HRV features and CNN-family classification.
Sample rejection and interpolation must be recorded. Peak-rejection thresholds and IBI correction should be fixed without using test labels; otherwise preprocessing can leak information.
Subject splits and folds
Segments from one participant are correlated. A random segment split can place one person’s patterns in both training and testing. When the target is generalization to unseen people, the split should group by subject.
Each cross-validation fold needs preserved train, validation, and test subject lists plus a seed. Scaling, feature selection, and missing-value processing must be fitted on the training fold and then applied to validation and test data. Dataset-wide normalization before splitting leaks test information into preprocessing parameters.
AUC, F1, and confusion matrices
AUC summarizes the tradeoff between true-positive and false-positive rates across thresholds. With strong class imbalance, ROC-AUC alone may hide poor positive-class precision, so a precision-recall curve is useful.
F1 is the harmonic mean of precision and recall. Threshold, positive label, and averaging method all change it. A confusion matrix exposes TP, FP, FN, and TN counts, making false alarms and misses visible. Sample-level and subject-level summaries should remain separate when subject sample counts differ.

Paper result and code archive
The paper abstract and conclusion report AUC 0.99 and F1-score 0.992. A separate five-fold CSV archive retains its dataset scope, folds, and aggregation conditions.
Each result bundle should retain its source file, dataset scope, exclusions, split unit, fold count, preprocessing version, model checkpoint, and metric code. Participant raw signals remain private; only group-level aggregates and a reproducible procedure are public.
Unverified items
Paper tables and archived fold results are separate evaluation records. Direct comparison requires the subject-group split, preprocessing version, and per-fold predictions.
Sources used
- PPG-HRV Cognitive Load CNN — public-repository; pipeline and metric conditions
- PPG-HRV project page — portfolio-page; published result boundary